 April 15, 2022
Test your website performance with chrome developer tools
Contents:
Introduction:
Nowadays very high end tools like GTMatrix, ScreenFly, Inspectlet and many more are available for testing website performance and other aspects, but very few people know that Google Chrome’s Developer tools are there to test all the performance parameters. In this blog we will see how we can use different tabs of Chrome DevTools to test the various parameters that affect website overall performance. We are considering mainly 3 tabs from DevTools for this article which are mentioned below:
- Network Tab
- Performance Tab
- LightHouse Tab
To access all these tabs first we will see how to access Chrome DevTools, it is very much easy to reach out to DevTools. You just have to simply right click on the web page or website you wanted to do test and select “Inspect” from the options.
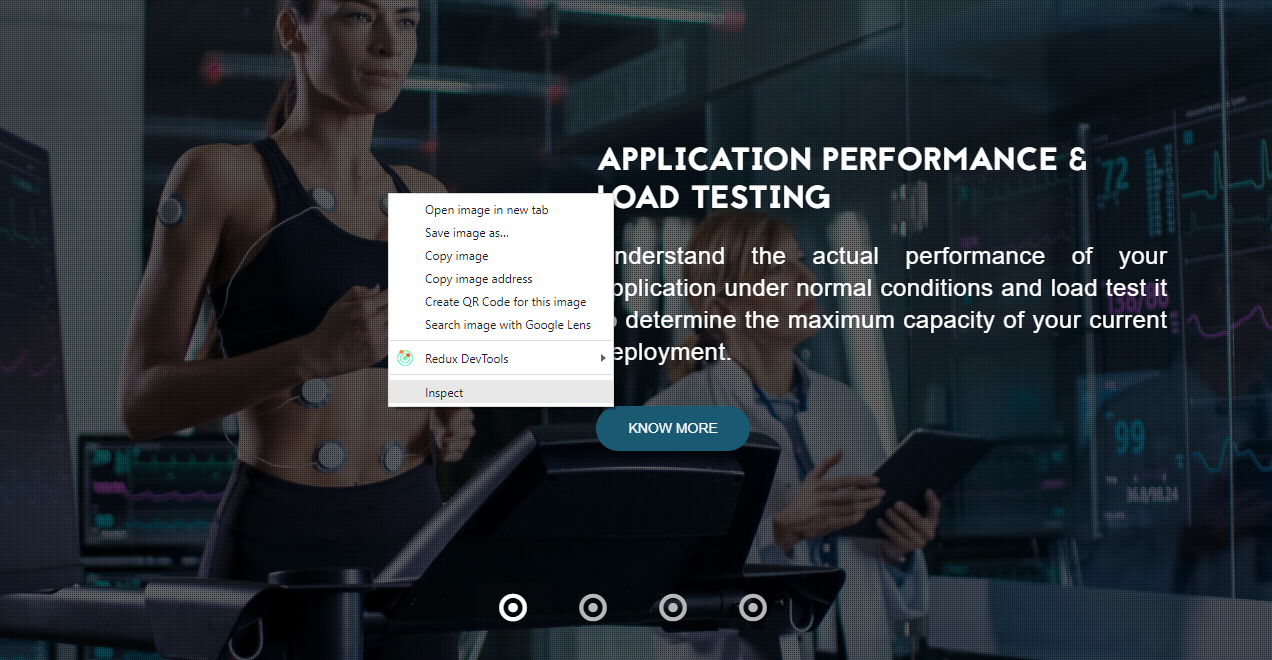
By selecting Inspect Chrome DevTool opens up in front of you and you can see different tabs mentioned above (and more)

Now we know how to access Chrome DevTools and its tabs we can move forward to check the usage and significance of all the tools which can be used in measuring performance and other criteria.
Note: There could be much more usage of each and every tab which are mentioned below but we only considered usage which affects the performance of the website.
Network Tab:
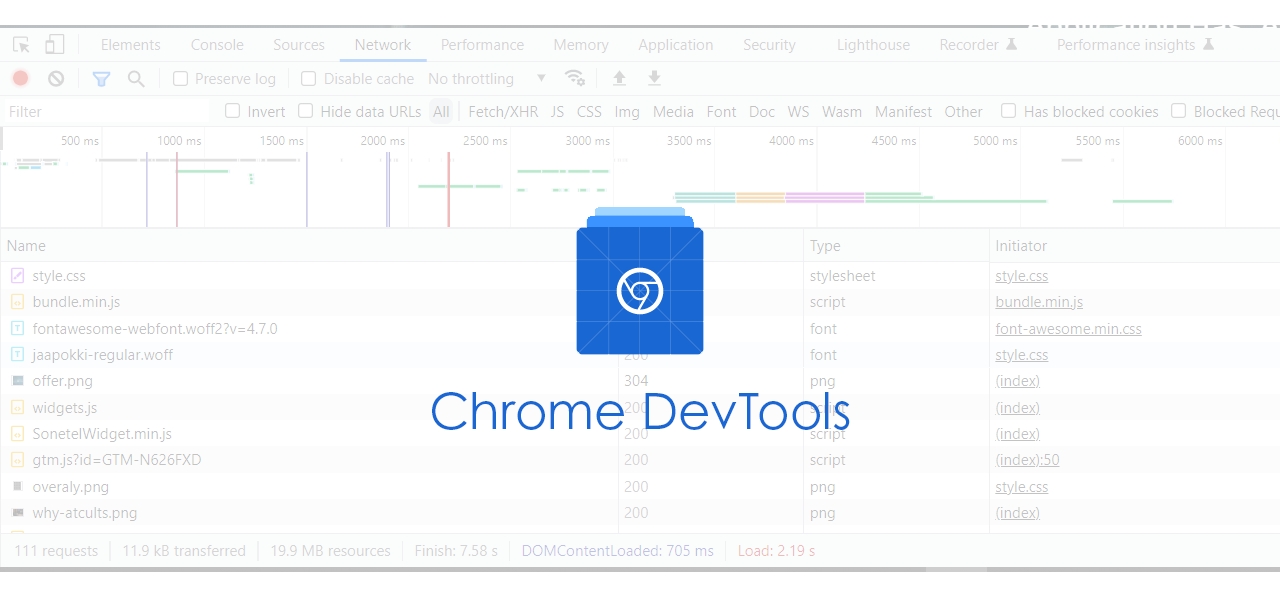
Generally network tab is vastly used to track Server Calls and API health by web developers but there is a specific section in network tab from which we can judge and benchmark the page load performance. We can see this section as a bottom bar in network tab:
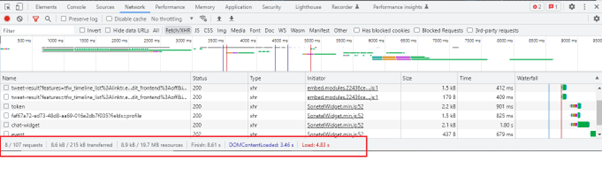
Mainly 6 parameters are considered in this bar:
1) Number of server requests : This parameter shows the total number of server requests web page sends which can include resource request, data request etc. To optimise the performance we need to minimise the number of server requests.
2) Weight of data transfer : This parameter shows the total weightage of data transferred between server and the web page . To optimise the performance we need to minimise the data transfer weight by optimising APIs, Code Footprints and Image sizes.
3) Browser resource usage : This parameter denotes size of browser resource usage to load the page and transfer the data.
4) Finish Time : This parameter showcases the total time taken to load the full page with DOM Elements, Data, Image Rendering etc.
5) DOM content load time : DOM content load time is time taken to load HTML DOM structure which does not include data or other elements which are not part of DOM or dynamically loaded by script.
6) Load time : Load time is time taken to load a full web page without Non DOM data which includes Script Rendering, Data Download, API calls, Media Download etc.
Performance Tab:
Wooof! Too much homework needed to explain this tab.
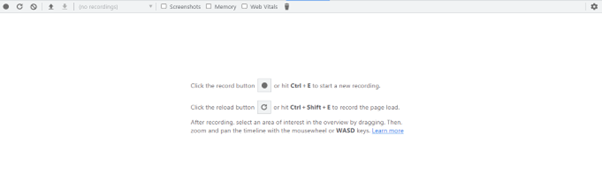
As the name suggests, this tab is dedicated to analyse all performance parameters. To analysing performance of web page there are 2 ways:
1) Start Recording : It start recording performance at the current point of time and the current point of web page status
2) Reload : It starts recording right after reloading the page so we can precisely check page load at the time of page load and DOM rendering.
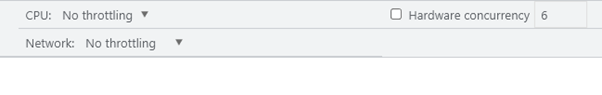
This tab also provides configuration which are variables for performance like CPU Config, Network Throttling etc. so you can test performance under various environmental setup.
Once we select config and choose the performance testing option it starts profiling the page and analysing the performance and once it’s done it redirects us to performance reports.

All the sections which are shown in the performance report are as shown below. We will understand the significance of each one by one.
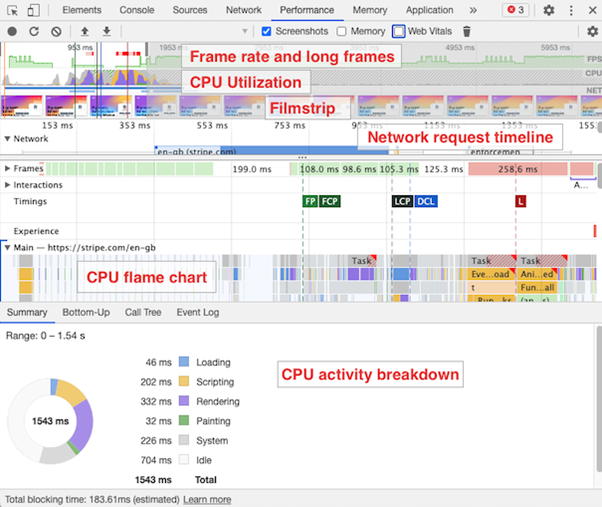
CPU Utilisation:

This chart shows how the CPU is utilised by different types of tasks, Like JavaScript Process(yellow) and DOM Rendering (purple).
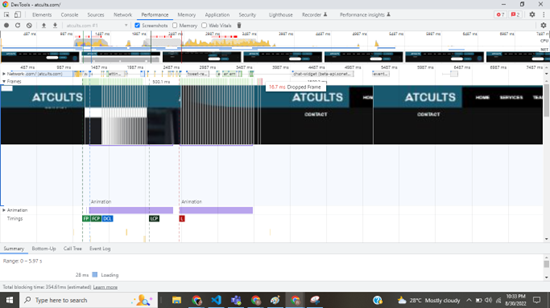
Filmstrip :
The filmstrip shows the rendering progress of your website in a different way. You can hover over the filmstrip to see a screenshot from that point in time.
CPU flame chart:
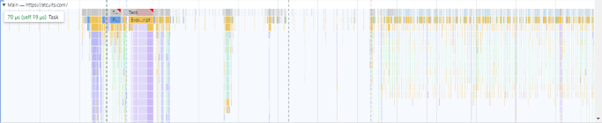
The main-thread CPU section contains an inverted flame chart showing how CPU tasks are broken down into different components.
Network request timeline:
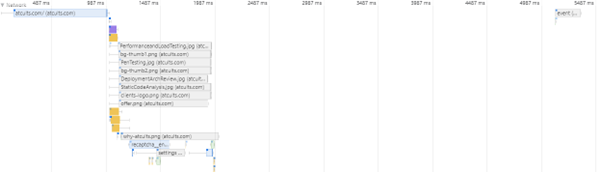
The network section shows a request waterfall, starting with the HTML request at the top and then showing additional requests below it.
Click on each request to see additional information like the full URL, request duration, resource priority, and download size.
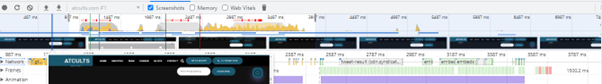
Frames and frame rate:
The Frames section of the Performance tab shows a screenshot of every UI update on the page. Each UI update is called a frame, and if the UI is frozen for a long time the frame is called a long frame. The screenshot below shows several long frames, where UI updates are delayed due to heavy JavaScript activity.
Long frames and the frame rate (Frames Per Second, FPS) are also shown right on top of the CPU activity chart.
These are the minimalistic parameters that we need to know from the performance tab. We will have a separate blog for the performance tab of Chrome DevTools and elaborate each and every functionality of the performance tab.
LightHouse:
LightHouse is a Chrome DevTool to test and provide us with suggestions to improve performance, SEO, security, best practices, and accessibility.
There are more than 70 parameters that are tested and provide us overall scoring. We are interested in some of the following basic parameters which are part of the final scoring of the website.
1) Performance : time to interactive, latency, speed index, resources optimization, TTFB, asset delivery, scripts execution time, DOM size, etc.
2) SEO : Mobile friendly, meta, crawling, canonical, structure, etc.
3) Best Practices : Image optimization, JS libraries, browser error logging, accessible over HTTPS, known JS vulnerabilities, etc
4) Accessibility : Page elements, language, ARIA attributes, etc
5) PWA (Progressive Web Application) : redirect HTTP to HTTPS, response code ok, fast loading on 3G, splash screen, viewport, etc.
To perform lighthouse test there are few quick steps to perform:
- Open Chrome browser
- Access your site to test
- Open Developer tools or right-click on the page and click Inspect.
- Go to the lighthouse tab
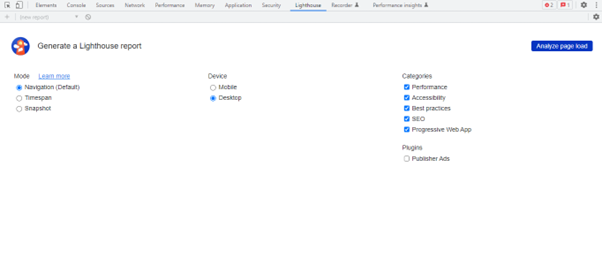
- Click “Analyse page load” button.
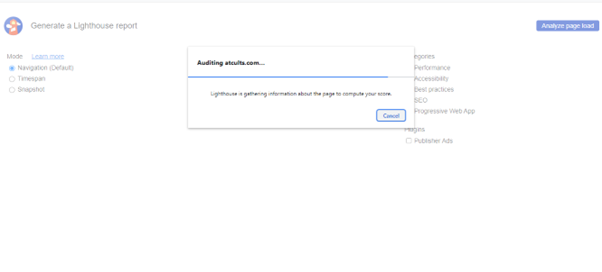
It starts analysing the page load and at the end of the processing it provides us the full analysis with performance scoring and provides suggestions to improve the performance.
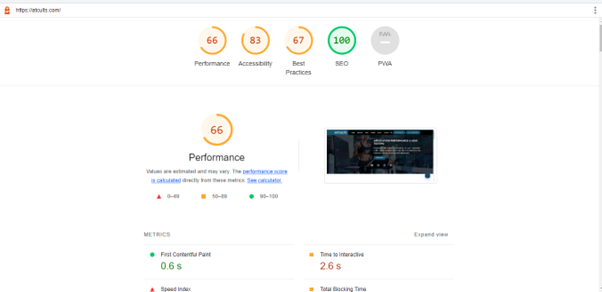
So, These are some Google Chrome DevTools which can test your webpage performance and help you to enhance performance and user experience.